
Posture
Enforcement trends over a time window — block rate, top policy rules, quota hits, top agents by denial, and dead-rule analysis.
Governance → Posture answers "is my policy actually doing anything, and what is it doing?" It aggregates the security-relevant event stream over a selected time window and turns it into enforcement trends, with every number one click away from the underlying events.
Window and scope
Posture shares its time-range presets with the Usage screen — last 1 hour, 24 hours, 7 days, or 30 days — and respects your workspace scope selection. Every KPI is computed for the selected window and the preceding window of equal length, so each figure carries a window-over-window delta.
Posture aggregates the most recent security-relevant events in the window (up to 200 per window). On very high-volume orgs, treat the rollups as a representative sample of recent enforcement rather than an exhaustive count — and use the Events screen for exact investigation.
What counts as a denial
A denial is any event whose outcome is denied, blocked, or modified — a
guardrail that modified the payload counts as a block, while masked is
treated as a soft outcome. Everything else in the window counts as allowed for
trend purposes.
Each denial is attributed to a rule key, in order of preference: the matched
rule id, then the declared domain (for egress denials), then a synthetic
quota:<scope>:<window> key for quota denials, and finally
allowlist-default for fail-closed denials that no named rule produced.
What the screen shows
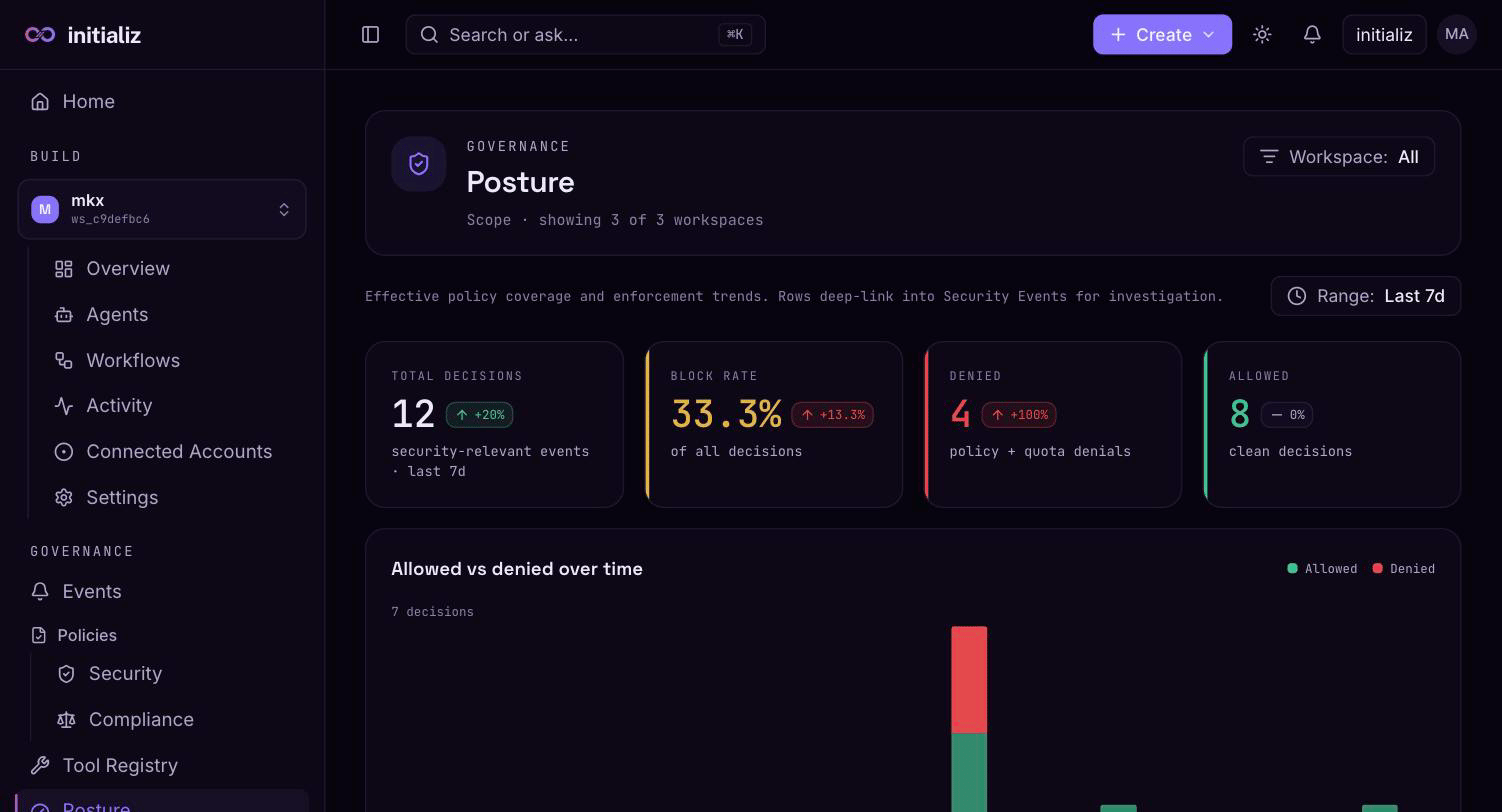
- KPI strip — total security-relevant events, denied, allowed, and the block rate (denied / total), each with its delta versus the previous window.
- Allowed-vs-denied trend — bucketed over the window (5-minute buckets at 1 hour, hourly at 24 hours, coarser at 7 and 30 days) so enforcement bursts are visible at a glance. A spike banner flags buckets far above baseline.
- Top policy rules — the five named rules with the most denials, labeled with the dominant event type behind each. Quota keys are excluded here.
- Top quota hits — the five
quota:<scope>:<window>keys with the most admission denials, shown as "scope · window" (for exampleagent · daily). Quota denials are kept distinct from policy denials so a strict token budget doesn't sweep the policy table and mask real policy signal. - Top agents by denial — the five agents with the most blocked events, split into policy-blocked versus quota-blocked counts.
- Dead-rule analysis — named entries in the published org policy (deny and allow list domains, tools, channels) that never fired in the window. These are cleanup candidates: rules that cost review attention but produce no enforcement signal. Limits and guardrails aren't part of this analysis — they aren't rules that fire by name.
Drilling into events
Every rollup row deep-links into Governance → Events with the time window and workspace scope preserved and the search box pre-seeded with the rule key, domain, or tool you clicked — so the path from "this rule fired 40 times" to the 40 actual events is one click. From there, each event opens into its detail drawer and can pivot to the full invocation or workflow execution timeline.
Approvals and consents
My Approvals — the personal queue of tool calls and workflow gates parked for your sign-off — and pending consents, where agents wait for a user to connect their own account.
Usage and quotas
Token and execution metrics on the Usage screen, and windowed token quotas that gate agent invocations at admission time.