Metrics
The metrics indicates the application's performance trends over time.
There are three key metrics :
1. Request Rate metrics : The request rate metrics quantifies the frequency of incoming requests to a server or application over a specified time period, typically expressed in requests per second (RPS)
Use cases
- Traffic Pattern Analysis
- Resource Utilization Assessment
- Bottleneck Detection
- Capacity Planning
- Performance Optimization
- Alerting and Monitoring
2. Error Rate metrics : The error rate metrics measures the frequency of errors in an application as a percentage of total requests, indicating reliability and performance. A high error rate signals potential issues that need addressing to enhance user experience.
Use cases
- Application Health Monitoring
- Issue Identification
- Alerting Mechanisms
3. Duration : Duration is a metrics that indicates the time taken between a request and its corresponding response, reflecting the application's performance and responsiveness.
Use cases
- Performance Monitoring
- User Experience Improvement
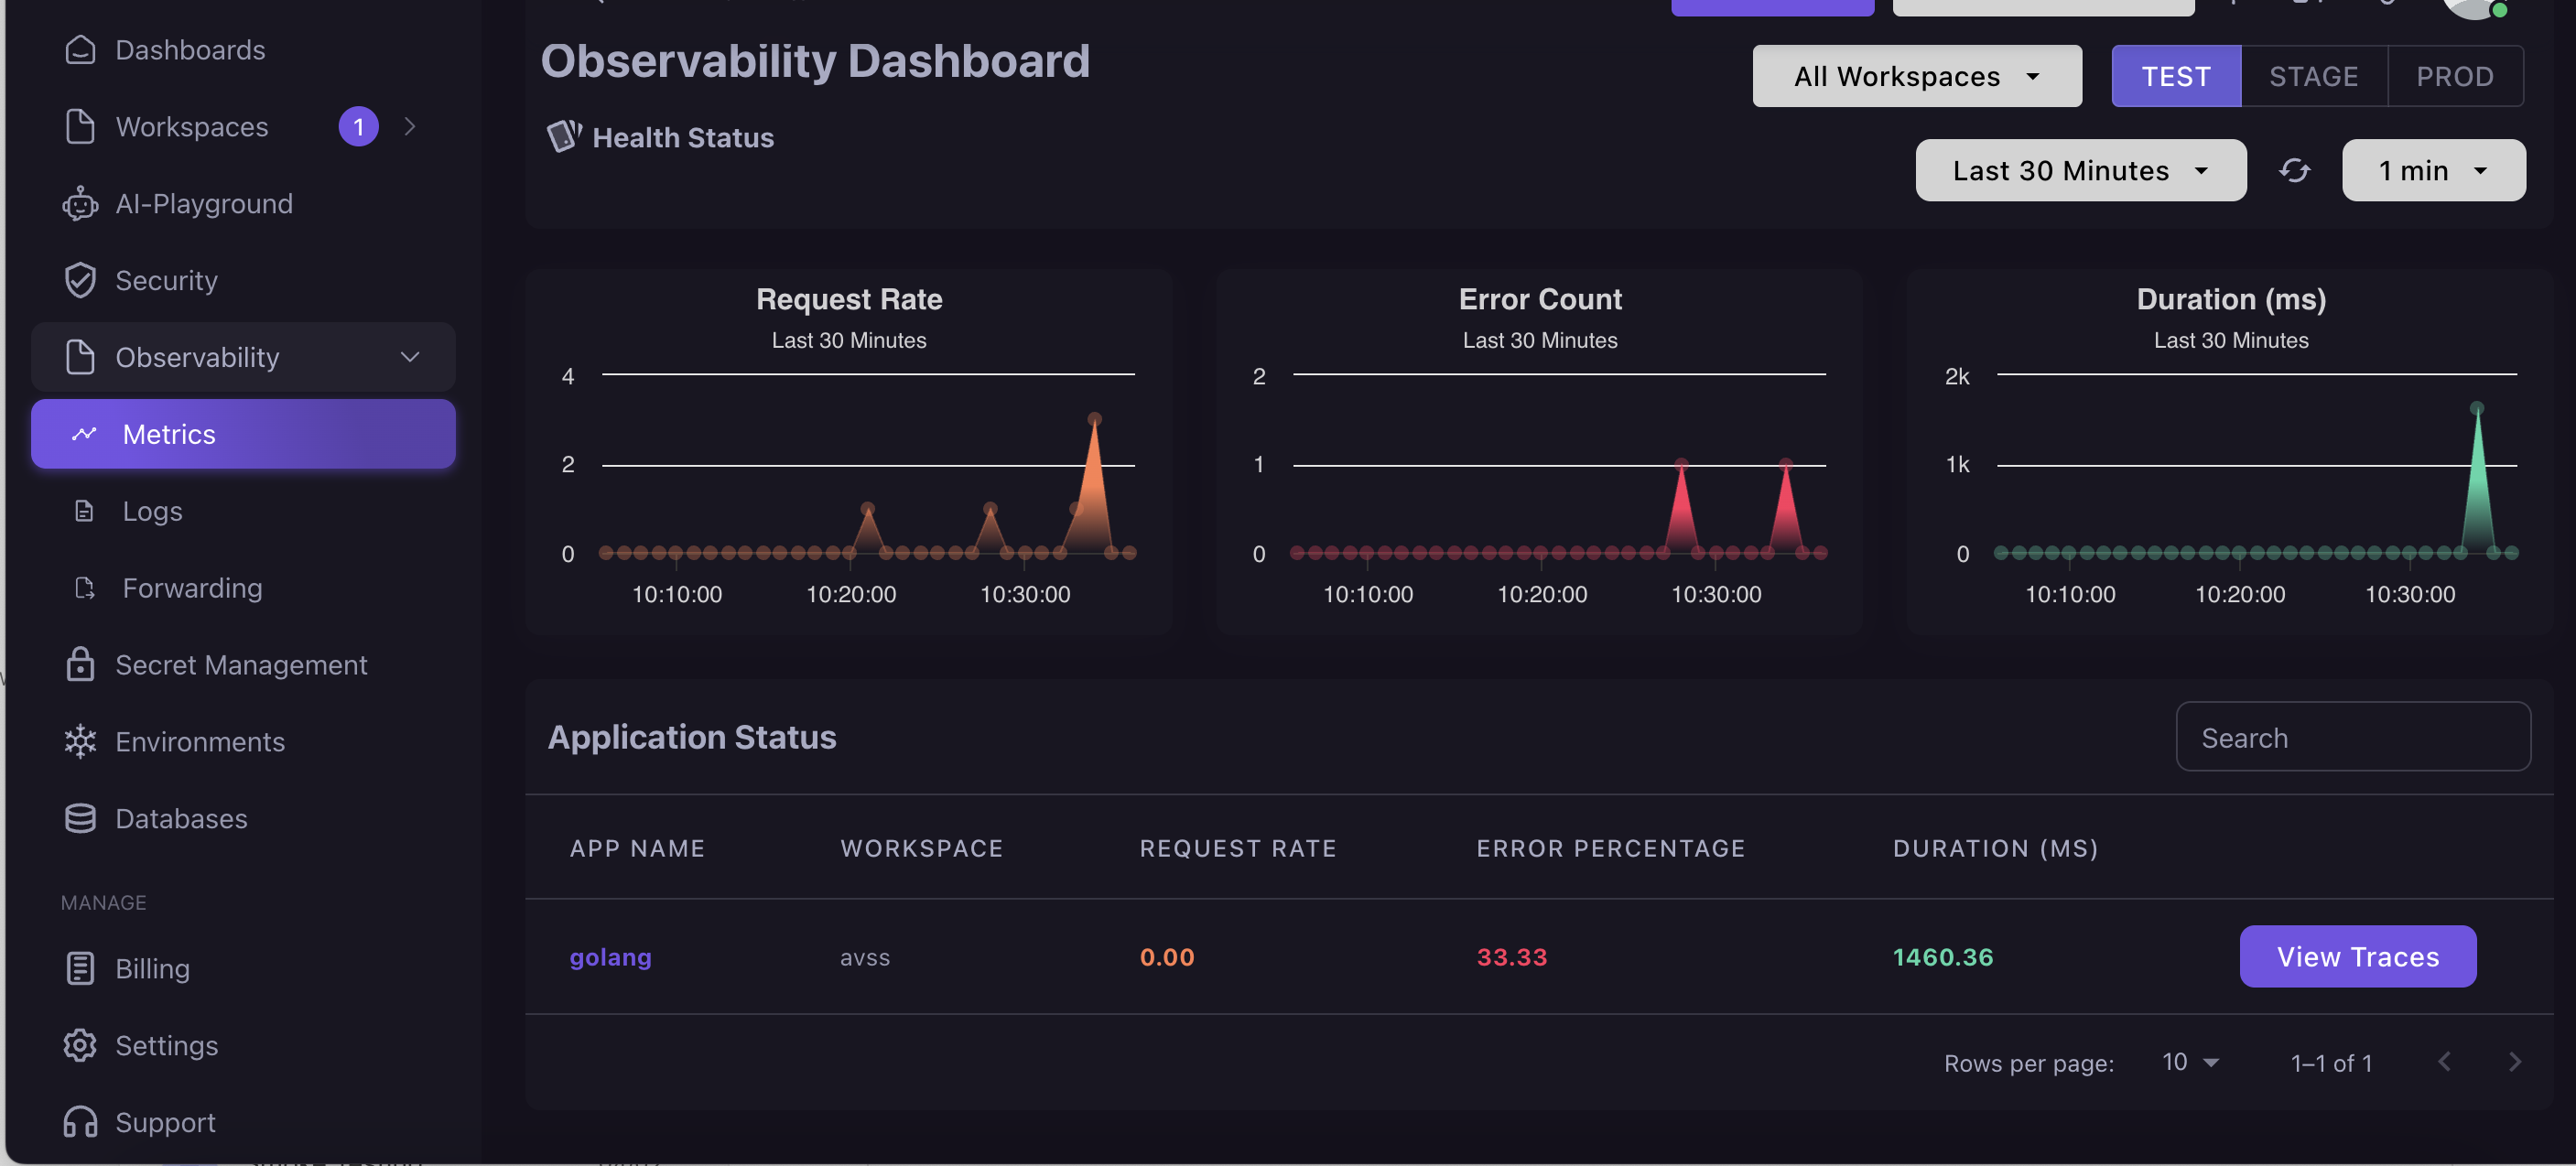
Accessing metrics tab
To view the metrics, follow these steps:
-
Select the Observability option from the sidebar.
-
Choose the metrics tab from the sub-options under Observability.
-
You can now view the request rate, error rate, and duration graphs for all workspaces, as all workspaces are selected by default.
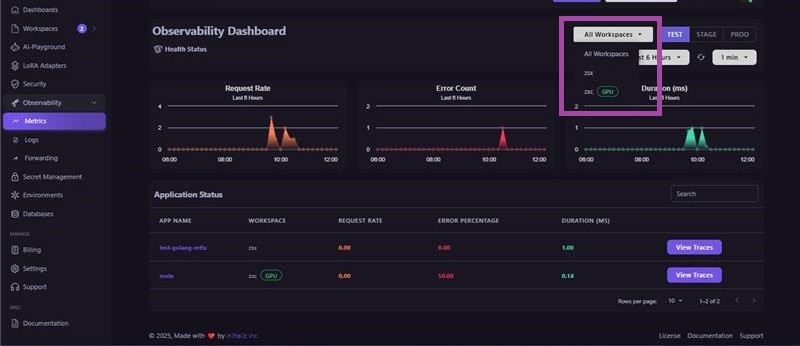
Filter metrics by workspace
On the right side of the metrics page, there’s a dropdown menu for selecting a workspace. You can choose between "All Workspaces" or a specific one.
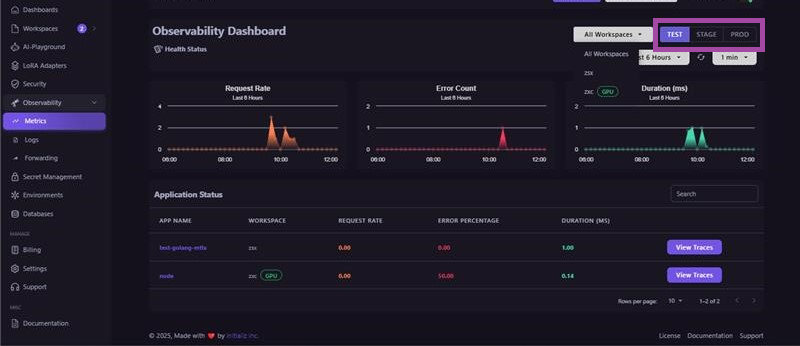
Filter metrics by Environment (Test/Stage/Production)
Next to the workspace filter, you’ll find three options to select the environment. You can choose the specific environment for which you want to view the metrics.
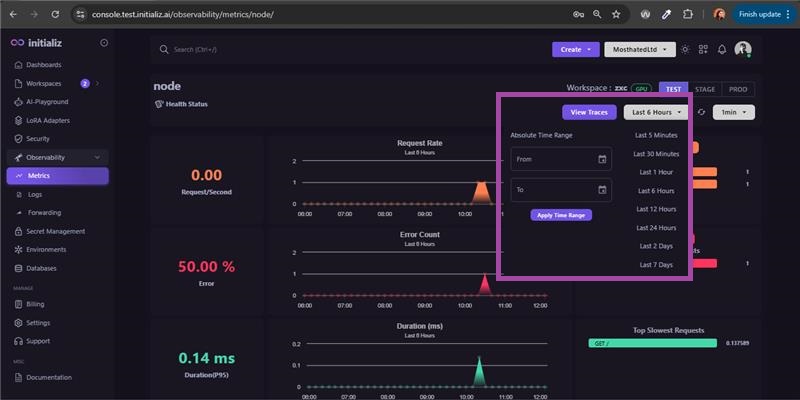
Filter metrics by Time range
You can view metrics for a specific time frame by selecting a relative time range.
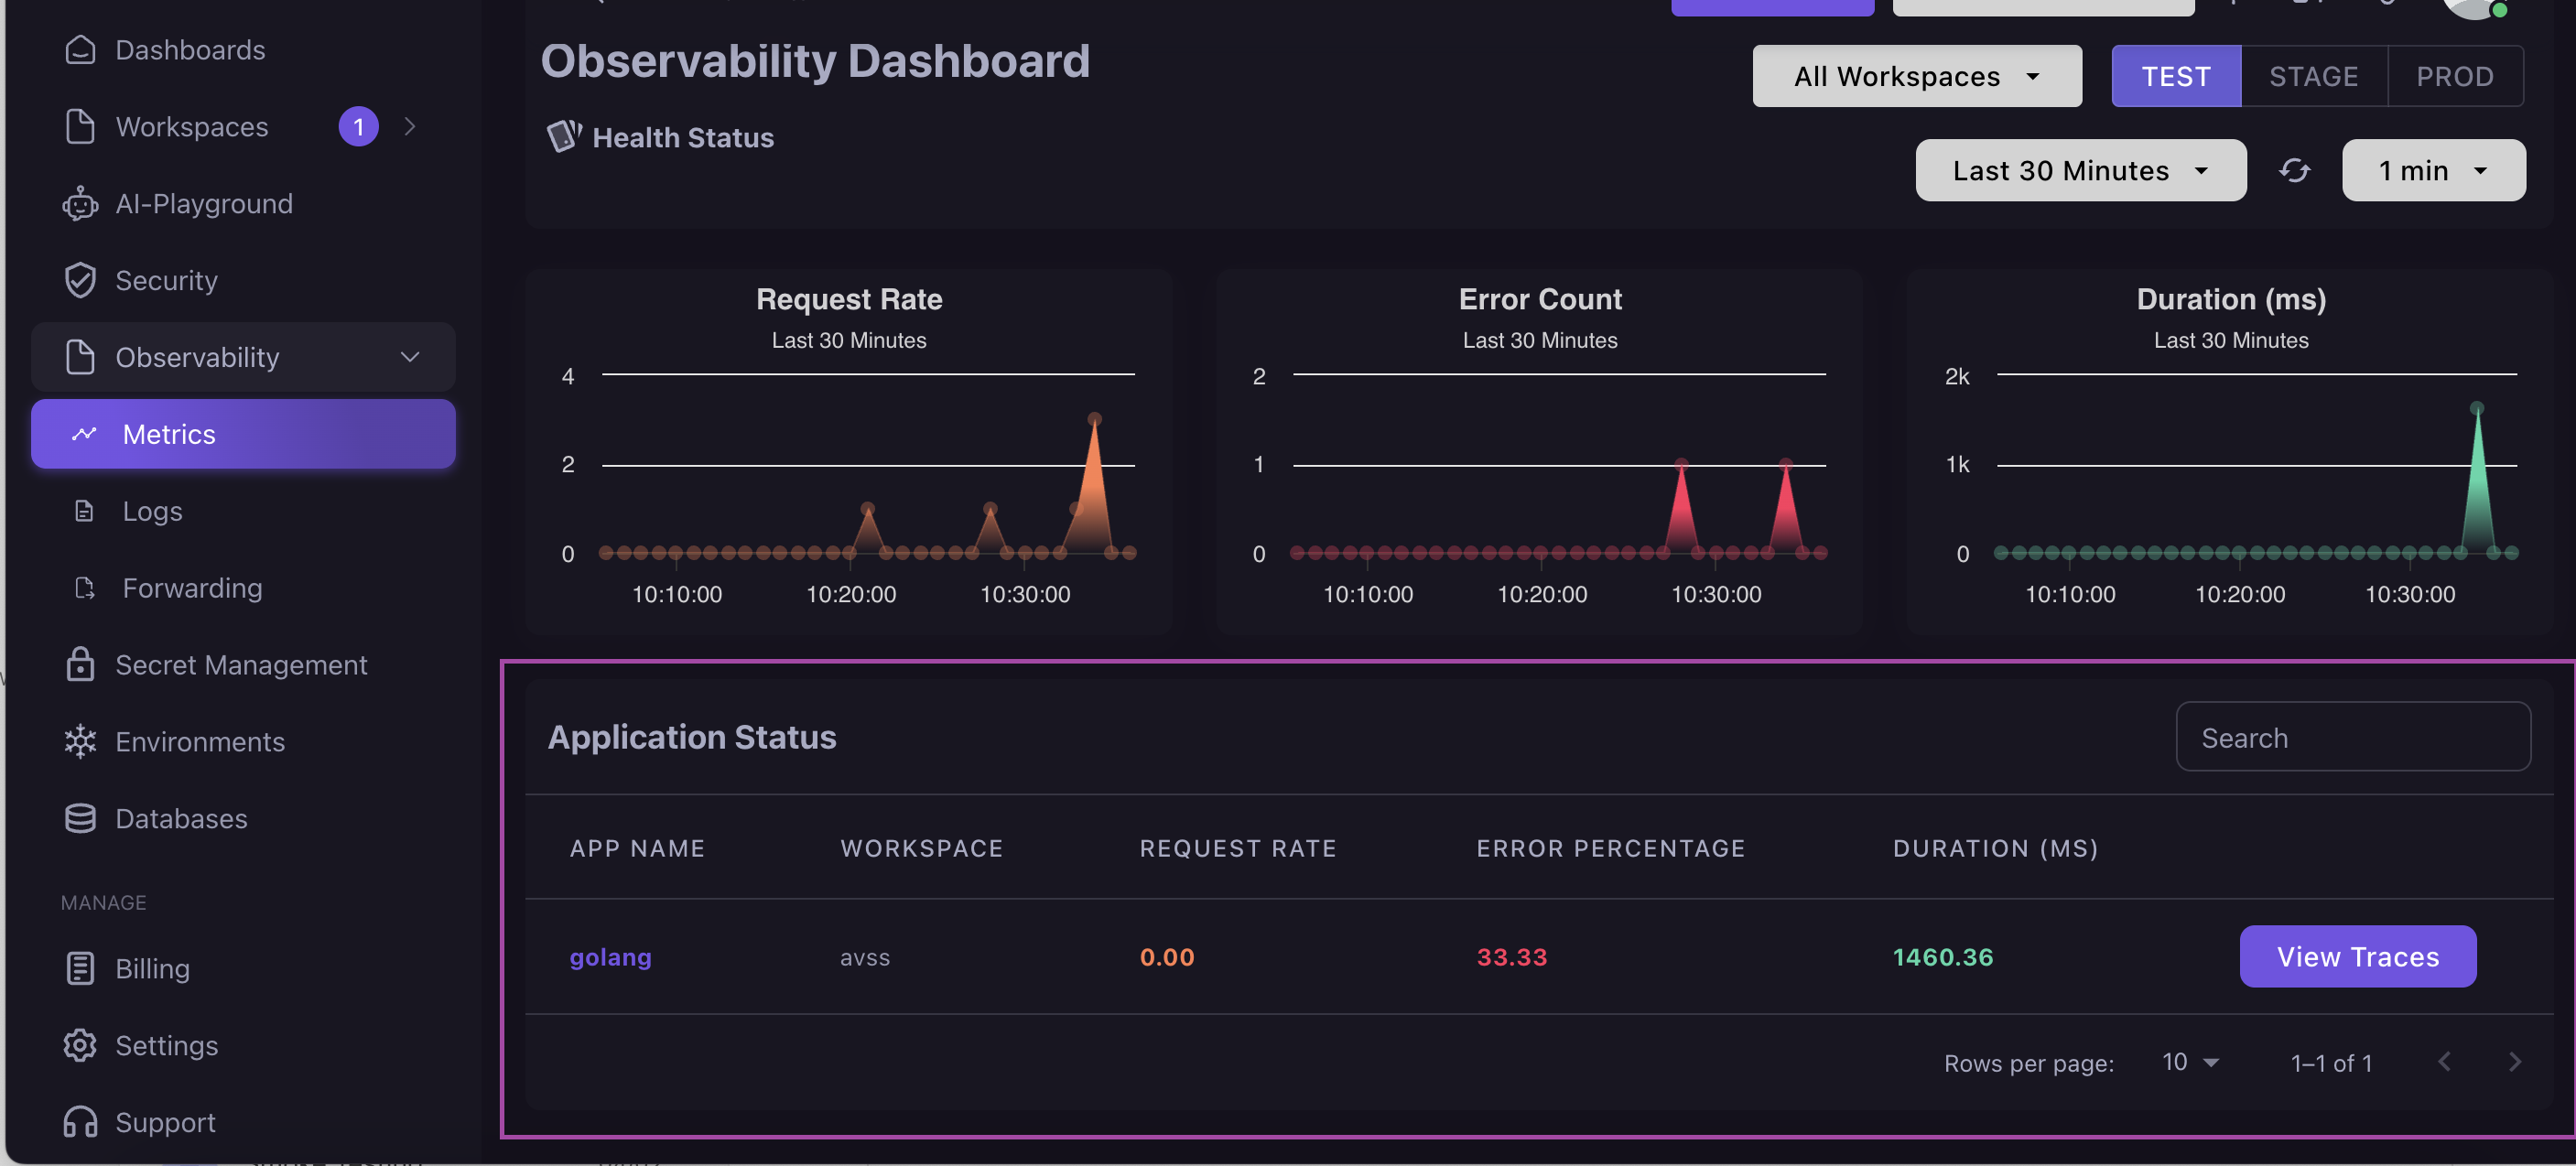
Specific application metrics
Scrolling down on the same page, you’ll find a section titled "Application Status," which displays all applications along with brief metrics details for the selected workspace. (Let’s take a closer look at each application metrics.)