Application Metrics
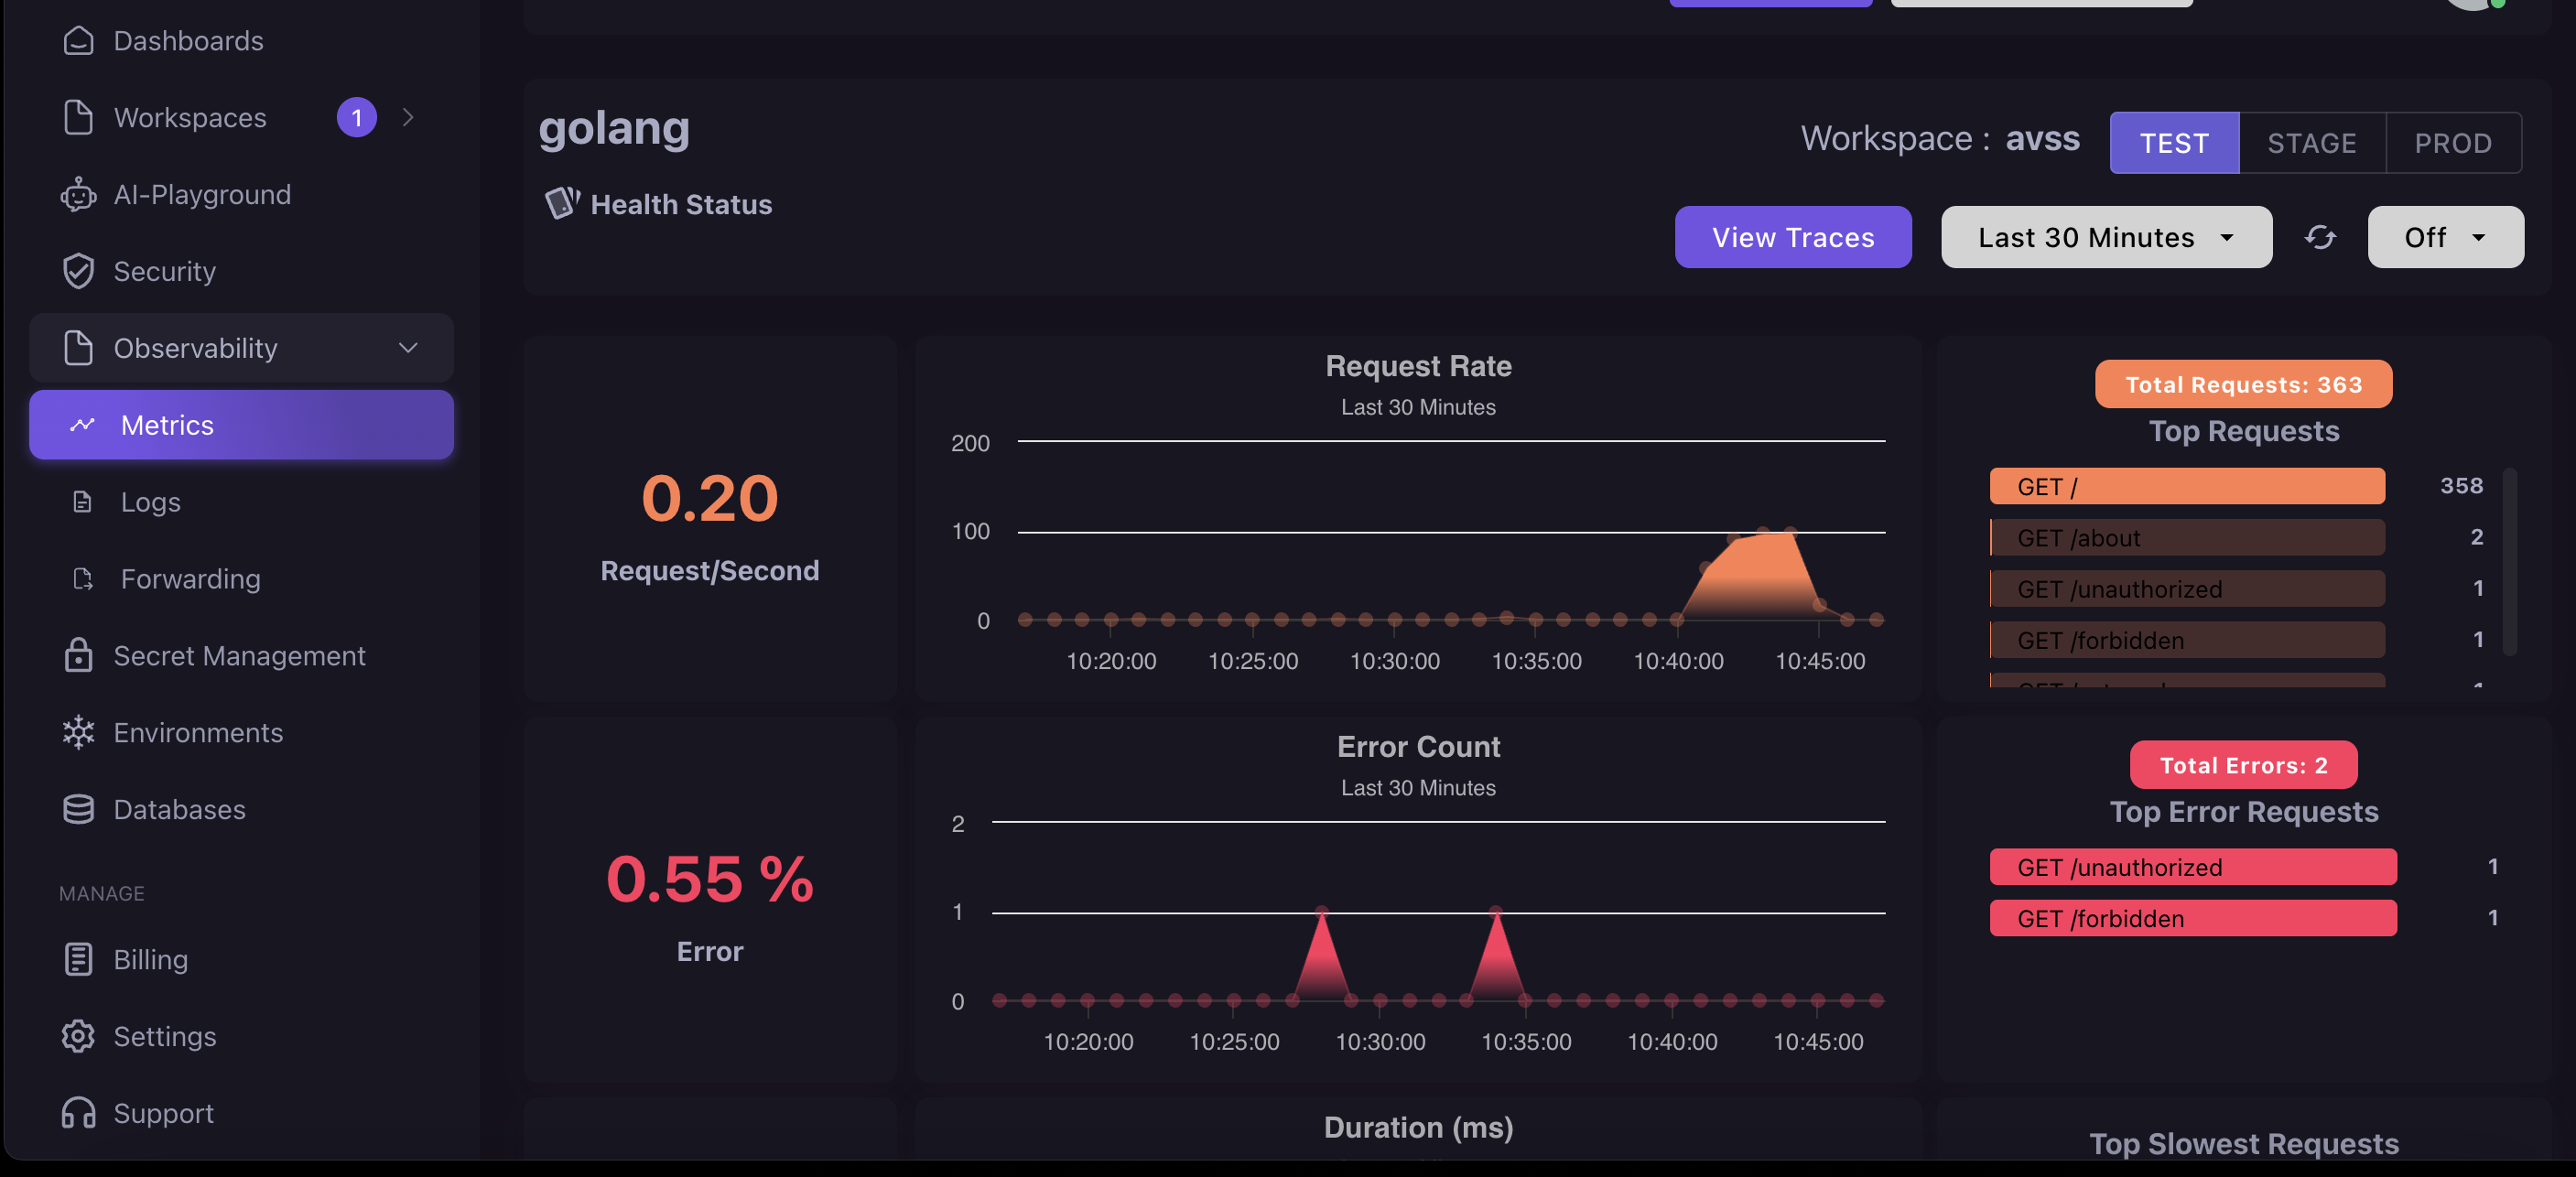
In the Application Status section, clicking on a specific application will take you to a detailed page that provides the following information:
- Request/Second Rate
- Error Rate
- Duration
Additionally, you'll find graphs illustrating:
- Request Rate
- Error Count
- Latency
The page also highlights:
- Top Requests
- Top Error Requests
- Top Slowest Requests
This comprehensive view allows you to monitor and analyze application performance effectively.
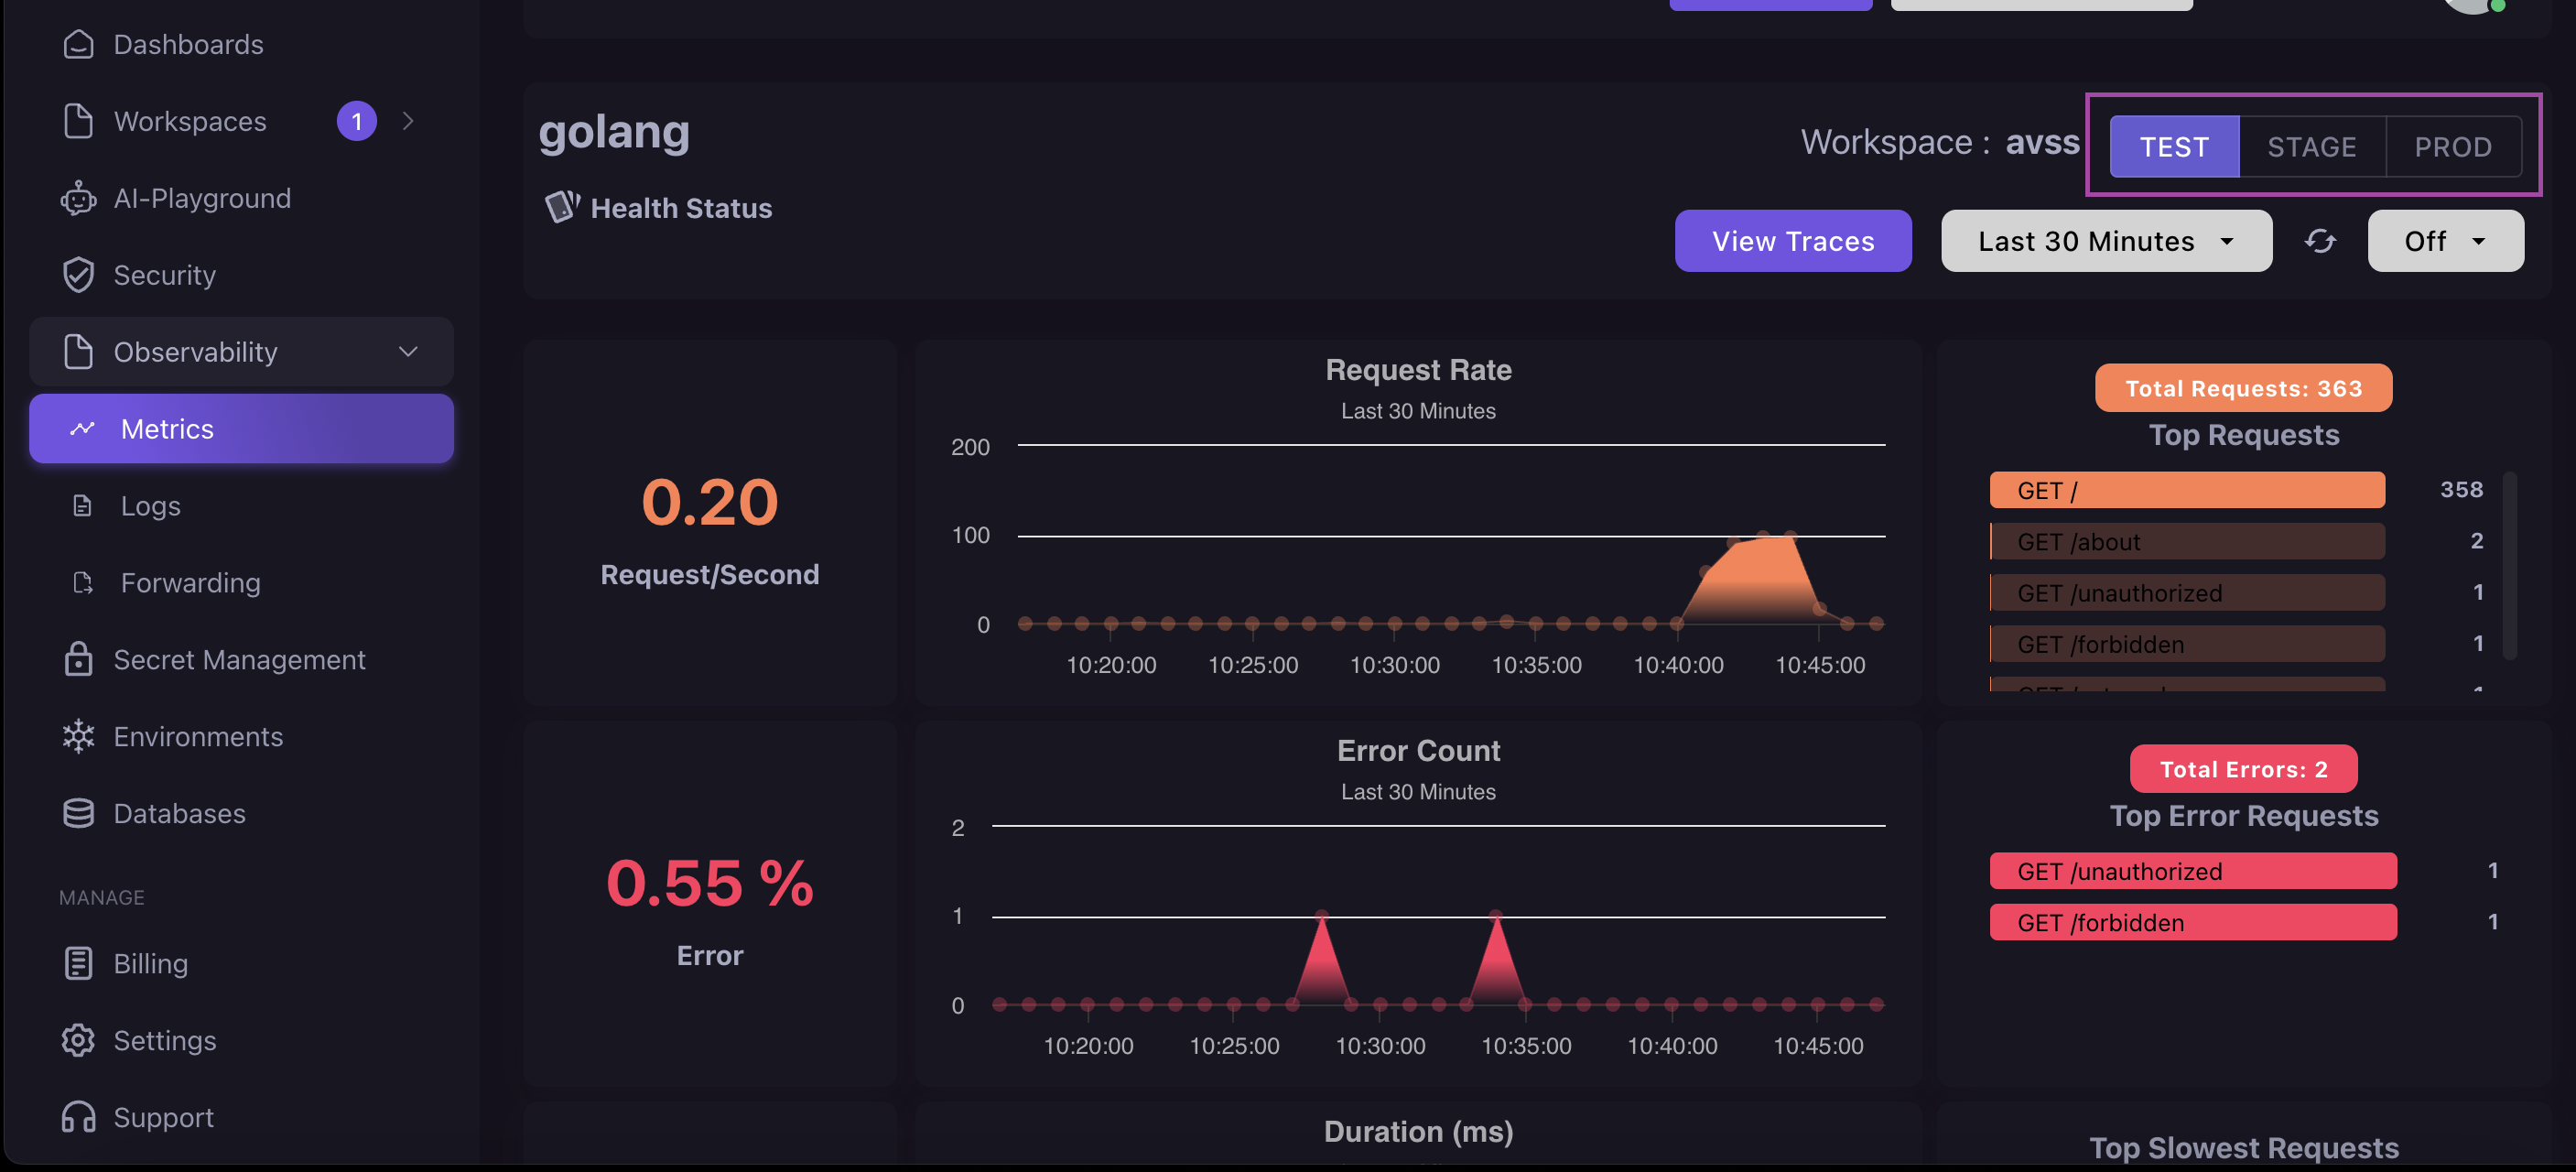
Filter application metrics by environment(Test/Stage/Production)
You can filter application metrics by choosing on of the environment option.
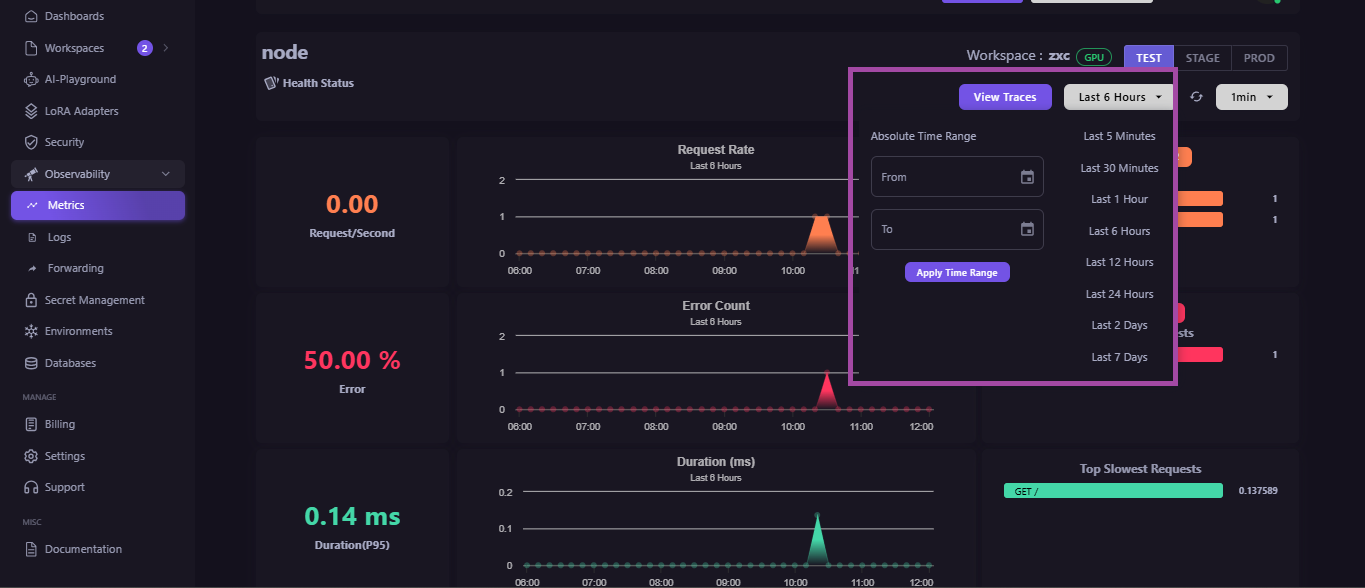
Filter application metrics by time frame
In order to filter the application metrics by time frame there are two option :
- Absolute Time frame
- Relative time frame