
Building and deploying
What happens after you create an agent — build progress, live logs, health states, and the failure diagnostics surfaced in the console.
When you create an agent (or apply a skill edit), the platform builds a container image for it and deploys it into your workspace. You don't run anything yourself — the console shows the whole process live.
Build progress
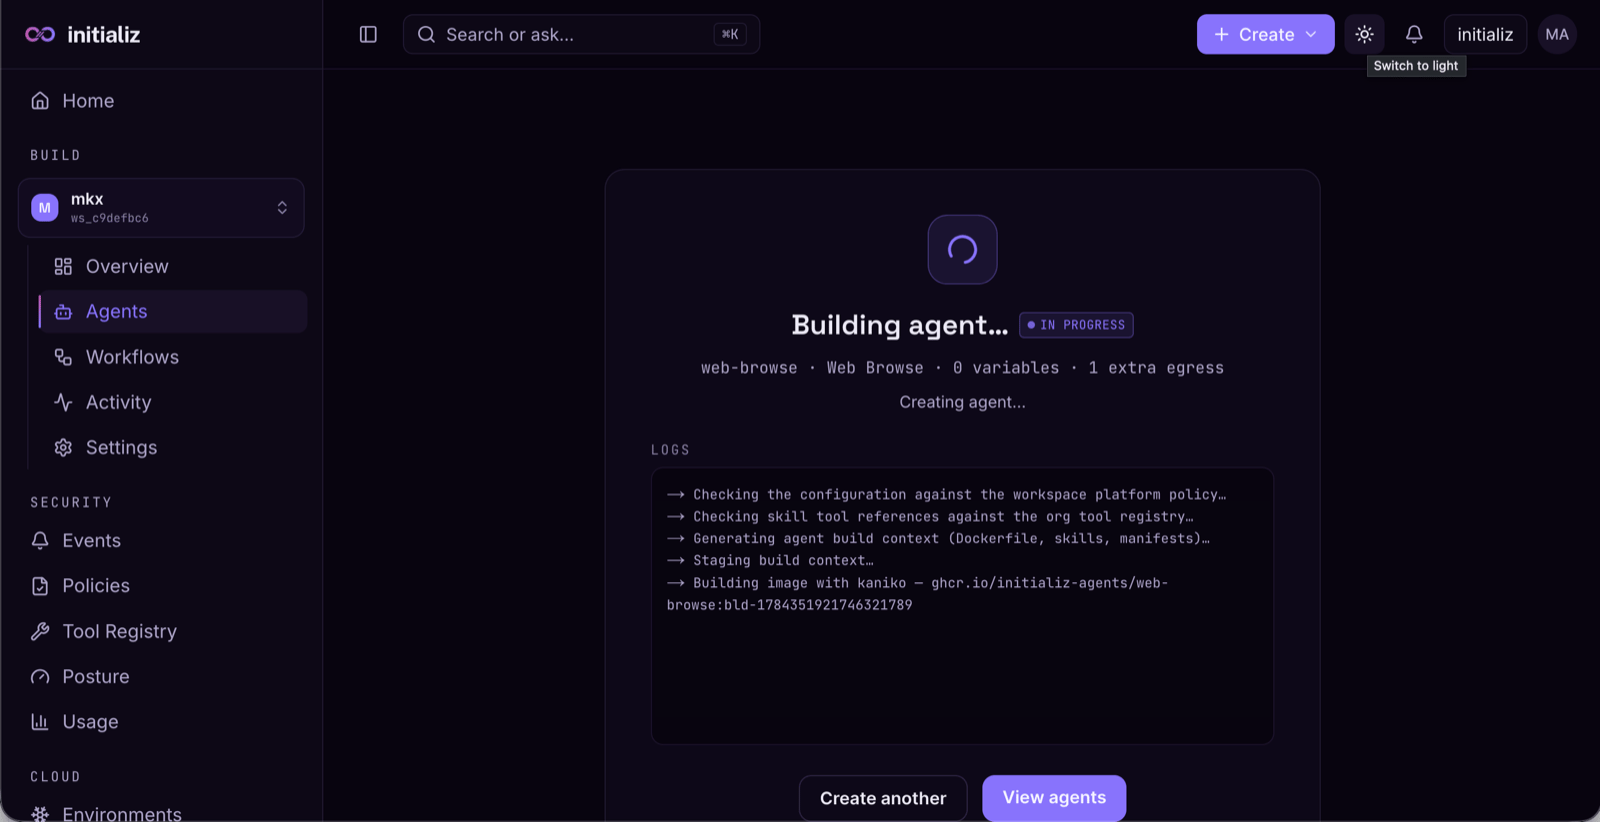
Right after create, the screen switches to a progress view that polls the build and streams its logs:
| Phase | Meaning |
|---|---|
| Building | The agent image is being generated and built. |
| Deployed / Starting up | The image was deployed; the agent is starting. |
| Running | The agent is up and healthy — terminal success state. |
| Degraded | The agent deployed but is not fully healthy. |
| Failed | The build or deployment failed — terminal failure state. |
The log panel pins to the newest line as the build streams. If a build runs unusually long, the view notes it is still deploying — you can leave and check back from the agent's detail page, which refreshes live while the agent is settling.
From the terminal states you can jump to the agent, create another, or (on failure) go back and adjust the configuration before retrying.
Health states
Every agent shows a status chip on the Agents list and its detail page: running, deployed, degraded, or failed (plus in-progress states while building). Health is read live from the running deployment, not from a stored snapshot, so the chip reflects what is actually happening right now.
Failure diagnostics
When an agent is degraded or failed, the detail page shows an actionable callout — not just a status chip:
- Runtime failures include per-container diagnostics: image pull errors, crash loops with the last exit reason, and instances the platform couldn't place.
- Build-stage failures have no running containers to inspect, so the callout falls back to the stored build error explaining which step failed.
The same diagnostics appear as marked lines in the create screen's log stream, so a failure is visible without leaving the create flow.
Diagnose
The Diagnose button on the agent detail page gathers the agent's evidence in one click — live health, the build error, recent audit events, and a log tail — and returns a diagnosis with a probable cause, suggested remediation, and citations. Every citation resolves to the same data shown in the Activity and Logs tabs, so nothing is claimed that you can't verify yourself. Diagnose is prominent when a failure callout is showing, and still available when health is green — behavior problems like policy denials or wrong outputs exist without any infrastructure failure.
Before the diagnosis is generated, Diagnose also runs a set of deterministic configuration pre-checks and feeds any findings in as citable evidence, so common misconfigurations are named exactly instead of guessed at:
- Tool schemas — tool parameters whose names the model provider would reject (one bad parameter makes the provider refuse every request).
- Service connections — a skill that acts through a workspace service connection that no longer exists, so those calls fail at runtime.
- Connection ceilings — operations the agent selects that a workspace connection no longer allows (for example after an admin narrowed it).
- Approval routing — approval prompts routed to Slack on an agent with no Slack channel, so deferred calls could never be approved.
- Environment — required, non-secret variables the skill declares but the agent doesn't set.
- Consent delivery — act-as-user operations with no delivery path for the connect prompt beyond the console.
- Schedules — an autonomous agent whose recent events show schedule changes but no schedule firing.
Each rule stays silent when its data source is unavailable — pre-checks report facts, never guesses.
Observing a running agent
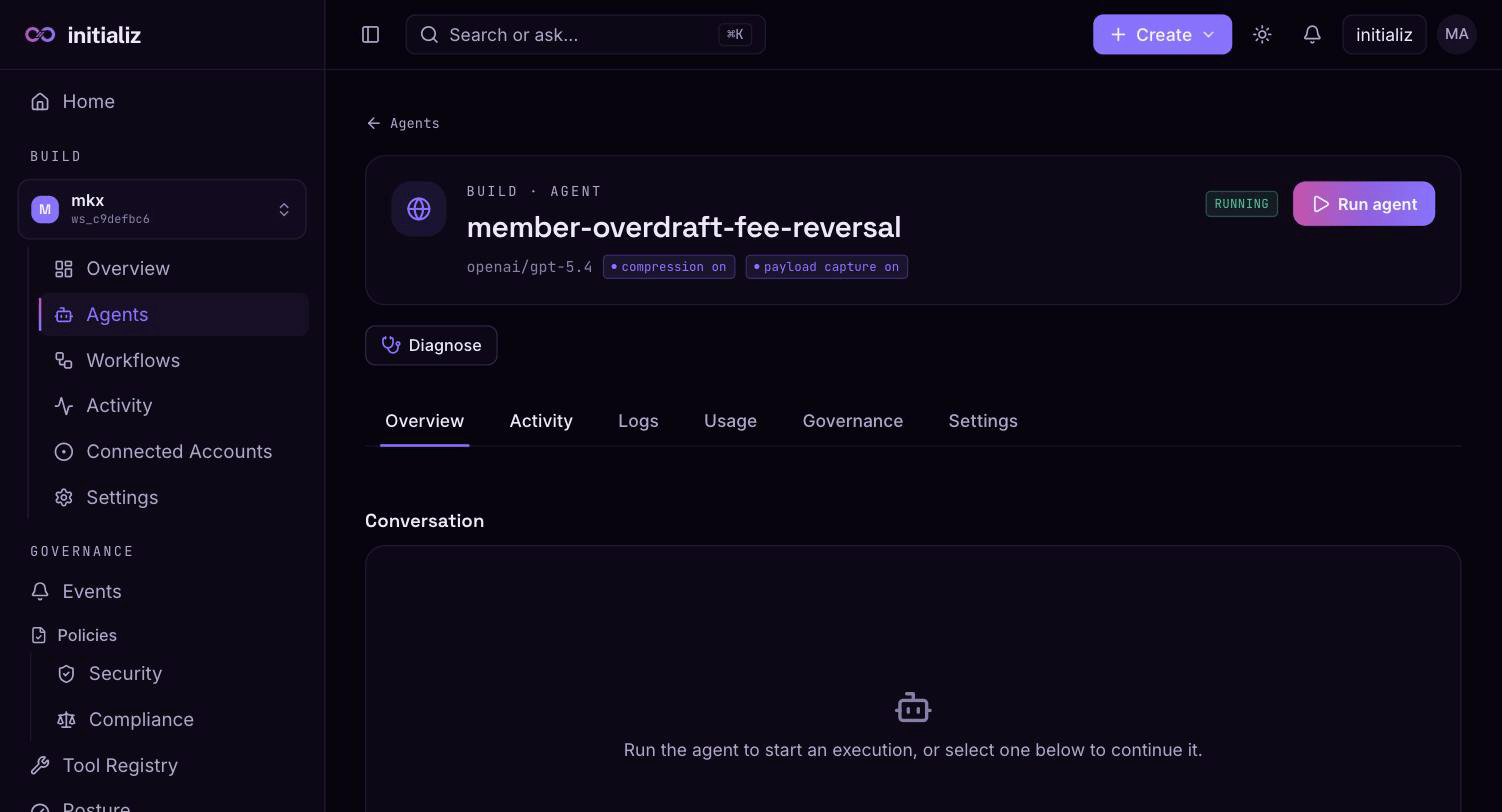
The agent detail page has tabs for day-to-day operation:
- Overview — run the agent directly (see Running an agent from the console) and browse its executions. The executions list is paginated with an accurate total; Load more fetches older pages.
- Activity — the agent's runtime audit event stream, grouped by run, with an in-place event drawer. Retained even after an agent is deleted.
- Logs — a bounded raw tail of the agent container for the cases events can't explain (stack traces, print debugging). Choose the tail size, refresh on demand, search with match highlighting, and read the previous instance to see the output of a container that crashed and restarted.
- Usage — the agent's model and token usage, with a 1h / 24h / 7d
window selector (each window shows its change versus the previous one).
Token counts are cache-inclusive: under prompt caching the input
figure includes cache reads and writes, not just the uncached delta, so
a large cached prompt is counted at its real size. Per-model-call rows
carry a
cached Nchip and a run's total sums its individual calls. For quotas and org-wide accounting see Usage and quotas. - Governance — the agent's own compliance rules: per-agent tightening over the org baseline, enforced when the agent has Enforce PDP policy on. See Compliance and tool-call decisions.
- Settings — the agent's endpoint card (its Agent Card as registered for workflow dispatch — with a clickable public Agent Card link when the agent is exposed off-cluster — or, for an HTTP-invoked agent, its HTTP endpoint URL, path, and method), build history and rollback, egress, skill editing, metadata tags, environment variables, the admin-only kill switch, and deletion (type the agent's name in the confirm dialog to delete). See Secrets and environment.
Running an agent from the console
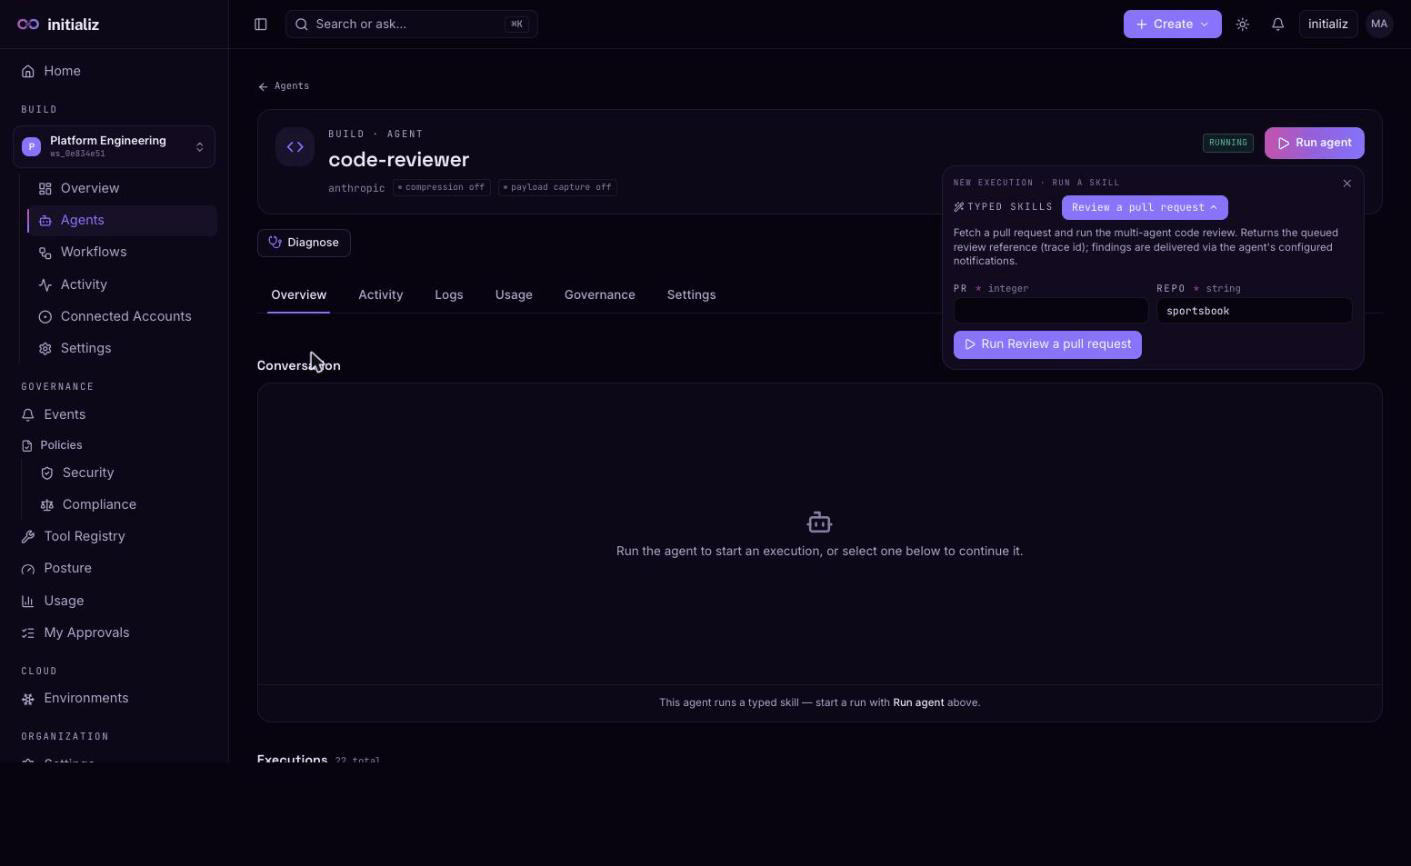
The Run agent button on the detail page starts a run, and the run shape follows the agent:
- Conversational agents get a free-text box and a chat composer — ask in plain language and continue the conversation in the thread.
- Typed-skill agents — agents whose skills declare structured input fields — get a form instead: pick the skill, fill in its fields (dropdowns for enumerated values, defaults prefilled, required fields enforced, numbers submitted as numbers), and run. List and object fields are first-class too: a field typed as a list of objects renders as a repeatable sub-form — one row per item with a typed input per property, plus add/remove row controls — so you never hand-type JSON for a known shape; a list of plain values accepts one entry per line (or a JSON array), submitted with each item typed per the schema; a free-form object field accepts JSON. A typed skill is a single structured call rather than a back-and-forth, so the conversation is result-only: the thread shows the invocation and its result, with no free-text composer. A failed structured run reopens its form for retry instead of dumping JSON into a chat box.
- HTTP-invoked agents (agents that answer plain HTTP rather than the agent-to-agent protocol, declared by their CI deployment) get a structured form built from their declared input schema — fields matching path placeholders fill the URL path, the rest form the JSON body — or a raw JSON body editor when no schema is declared.
Every console run acts as you, not as a shared workspace credential: the platform authenticates the invocation with your own verified sign-in, short-lived and per call — the agent never holds a long-lived credential of yours. So the agent's Activity shows who really invoked it (even when several teammates use the same agent), and tools that act on behalf of the requesting user act with your identity and your connected accounts.
Agents built for long-running work may accept a run and finish it in the background rather than answering inline. The conversation simply stays in progress while the agent works and completes on its own when the result lands — you don't need to re-ask or refresh. And when a skill's answer is structured data rather than prose, the thread renders the returned fields as compact JSON instead of showing an empty reply.
If a governed tool call inside the run is deferred for approval, the conversation doesn't hang: the turn shows a deferred state ("this action needs approval before it can run — it's been sent for review") while the call parks. The approver decides in My Approvals (or Slack), and the outcome lands in the conversation once resolved. See Approvals and consents.
The kill switch
Every agent carries an emergency stop. On the Settings tab, admins (workspace admin, organization admin, or security admin) see a Kill switch card with a Kill agent control and an optional reason field. Killing an agent is one action that both stops what it's doing and keeps it stopped:
- Active work is cancelled — in-flight runs are asked to stop gracefully, then the agent's workload is scaled to zero regardless.
- New work is refused — the Run button is disabled, direct invocations stop, and workflow steps that dispatch to the agent fail immediately with an explanatory error instead of retrying a dead endpoint (see Agents in workflows).
- Its addresses are hidden — the endpoint card and any public Agent Card link are replaced with a note that the agent is killed, so a scaled-to-zero agent never advertises an invoke URL.
- Rebuilds are blocked — a build or redeploy of a killed agent is refused, so a routine rebuild can't silently resurrect it.
While killed, the agent's detail page shows an amber Killed banner recording who killed it, when, and the reason given. The state is reversible and distinct from deletion: nothing about the agent's definition, history, or events is lost.
Restore agent (same card) brings it back — the workload scales back to its previous size and the agent rejoins workflow dispatch. If the agent's deployment no longer exists by then, the restore is refused — redeploy the agent instead.
Both actions are recorded as security events attributed to the verified identity of the admin who acted — see Security events.
Build history and rollback
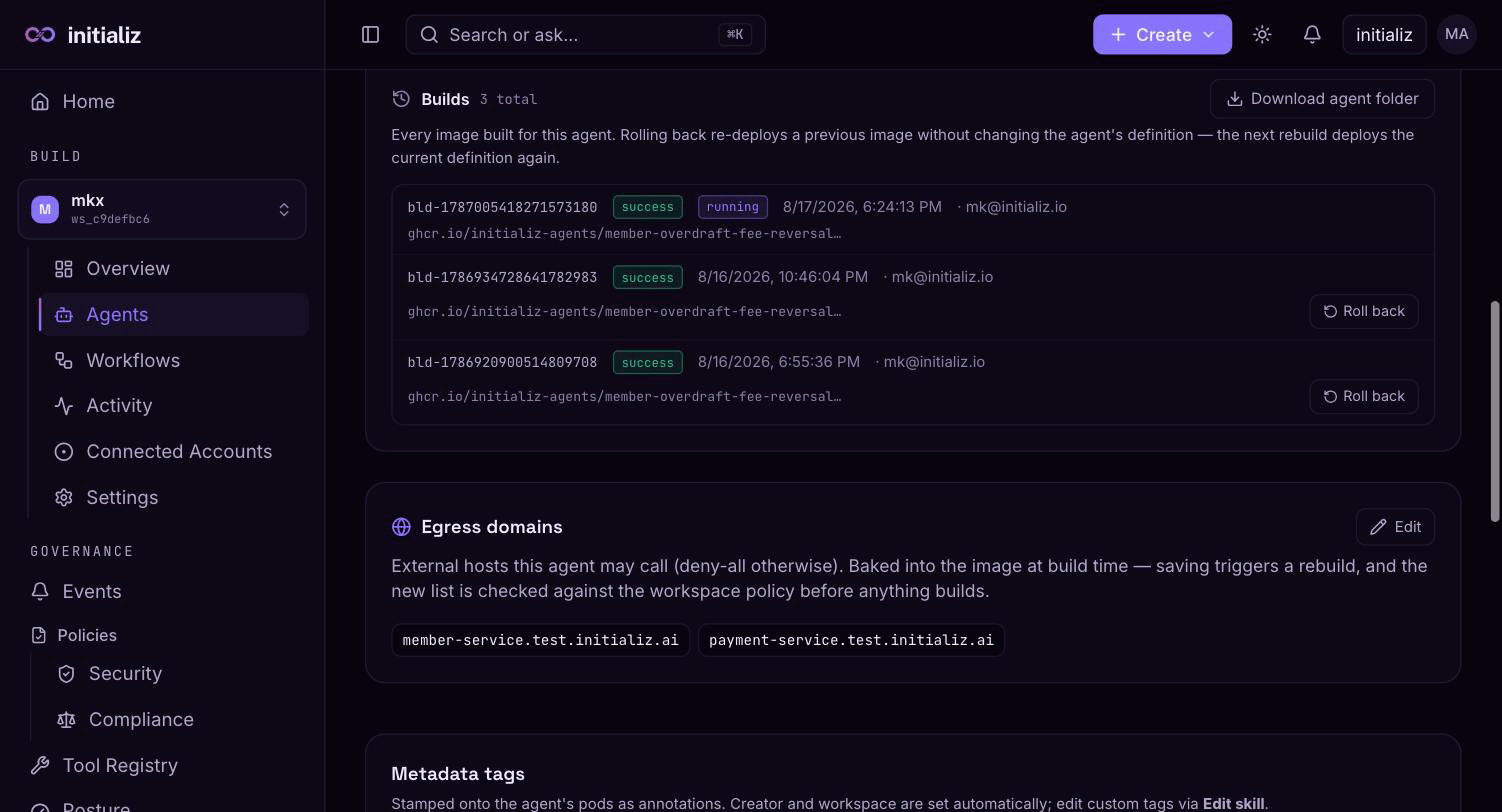
The Settings tab's Builds card lists every image ever built for the agent — status, when it finished, who triggered it, and the image tag, with the currently running build marked. The list is paginated with an accurate total; Load more fetches older builds.
From the list, an admin can roll back to any previous successful build. Rolling back re-deploys that build's image without changing the agent's definition — so while a rolled-back build is running, a banner warns that the running image no longer matches the agent's current definition, and the next rebuild (for example after a skill edit) deploys the current definition again.
The Builds card also offers Download agent folder — the agent's complete build folder (skill documents, scripts, and build configuration) re-materialized from its current definition, with no secrets inside. Useful for auditing exactly what the agent runs, or as the starting point for moving an agent into your own CI pipeline.
For CI-deployed agents, both rollback and the folder download are hidden — the repository their CI builds from is the source of truth, so previous images are rolled by deploying again from CI.
Rebuilds and restarts
Two different update paths, with very different costs:
- Skill, egress, or model changes rebuild the agent image and redeploy it — this takes a few minutes and goes through the same progress view as the first build.
- Environment value changes patch the agent's secret and restart it — no rebuild, effective in seconds.